Applies To: ThreatSync+ NDR, ThreatSync+ SaaS
The Traffic page provides a powerful search and filter interface that enables you to perform a deeper investigation into activity on your network. You can open the Traffic page from several other locations in the ThreatSync+ UI. When you navigate to the Traffic page from another page, it is automatically prepopulated with filters to show you details about the Smart Alert, behavior, policy alert, asset, or node you previously viewed.
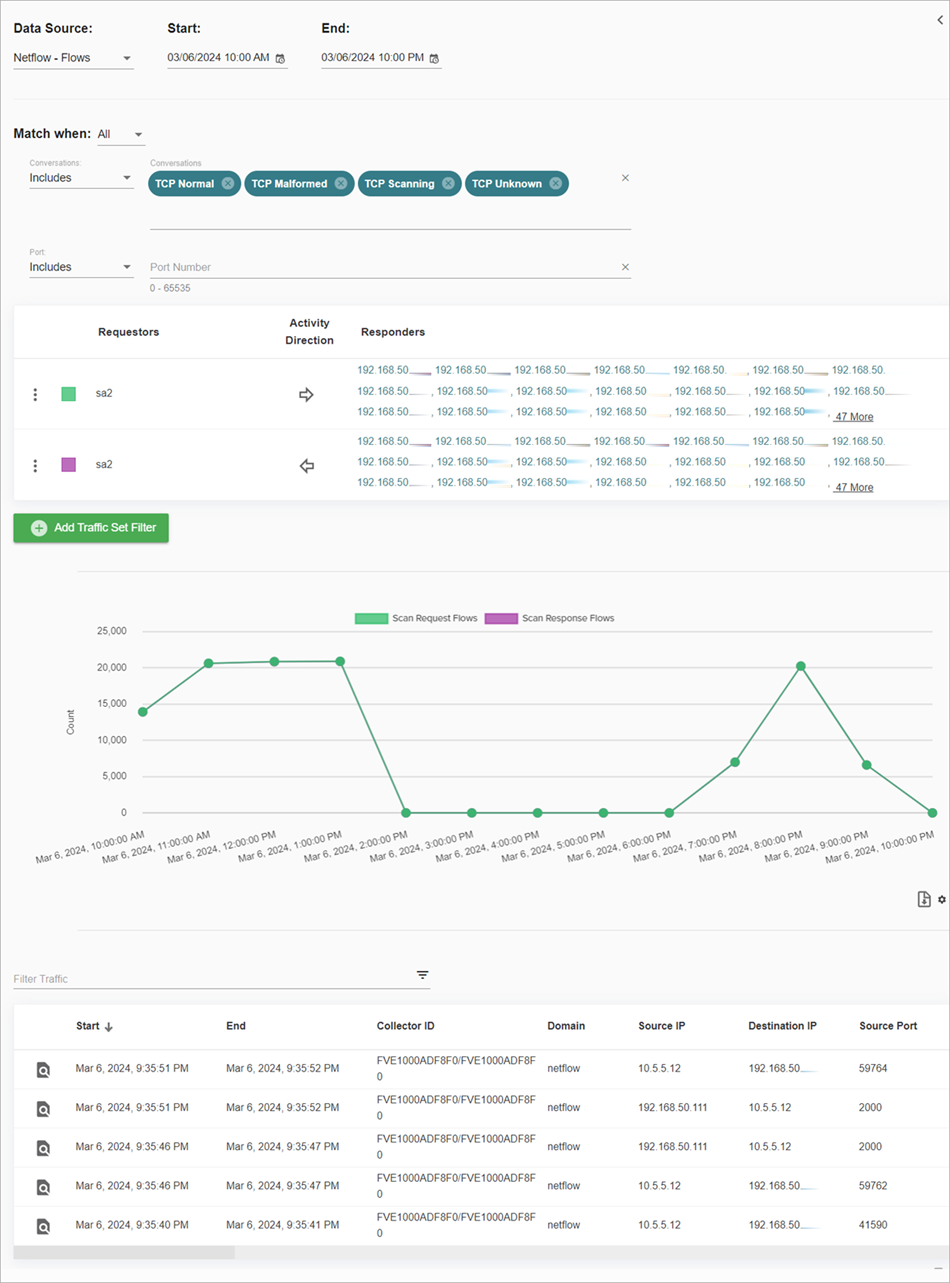
The Traffic page has these components:
- Activity filter controls
- Activity chart
- Detailed activity records
- Known Actor pane
Activity Filters
Activity filters enable you to select the type of activity to show. This enables you to narrow results based on data and traffic filters you select.
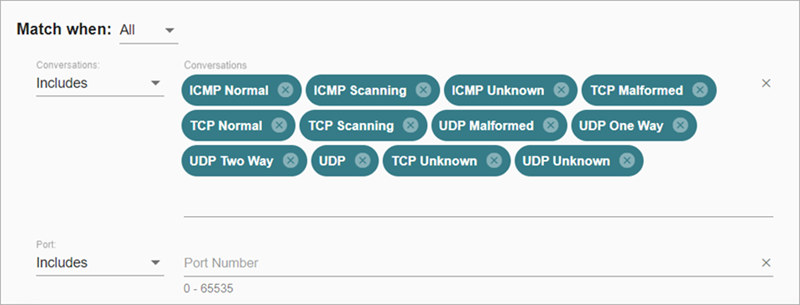
You can use specific activity filters to filter information you view on the page.
For more information about activity filters, go to these sections:
Data Source
If your collectors receive traffic logs or NetFlow feeds from Fireboxes or ThreatSync+ NDR Collection agents, these data sources are available:
- NetFlow flow counts
- NetFlow packet counts
- NetFlow byte counts
- Anomalous events generated by ThreatSync+ NDR
Data Filters
Available data filters depend on the type of data source selected. This table explains which filters are available with which data sources.
| Data Filter | Description | NetFlow Data Sources | Events Data Source |
|---|---|---|---|
| Port Number | Application port number. This is usually the destination port used by the requester when they communicate with the responder. | Yes, for TCP and UDP | Yes |
| Conversations | Calculated by ThreatSync+ NDR based on the protocol type, flags, and time of the NetFlow logs, which indicate the nature of the conversation. The values indicate whether the protocol is ICMP, TCP, or UDP, and if the flows are part of a two-way conversation or are unanswered. | Yes | Yes |
| Anomaly Type | The type of anomalous event generated by the ThreatSync+ NDR analytics engine. | No | Yes |
You can configure each filter type to:
- Include all activity records of one of more selected values.
- Include all activity records except the selected values.
- For the Anomaly Type data filter, you can edit the Alert Severity scale when one or more of these anomaly types are selected:
- Large Volume From Asset
- Large Volume To Asset
- Large Packet Count From Asset
- Large Packet Count To Asset
- Data Sent To Large Number Of Hosts
- Data Received From Large Number Of Hosts
- Data Sent To Large Number Of Cities
- Data Received From Large Number Of Cities
- Unusual Outgoing connection duration
- Unusual Incoming connection duration
- High Ratio Of Outgoing Bytes Per Incoming Bytes
- High Ratio Of Incoming Bytes Per Outgoing Bytes
- High Ratio Of Outgoing Packets Per Incoming Packets
- High Ratio Of Incoming Packets Per Outgoing Packets
- High Rate Of Incoming Bytes
- High Rate Of Outgoing Bytes
- High Rate Of Incoming Packets
- High Rate Of Outgoing Packets
- High Count Of Incoming Flows
- High Count Of Outgoing Flows
- Unusual Rate Of Incoming Bytes Per Flow
- Unusual Rate Of Outgoing Bytes Per Flow
- High Ratio Of Incoming Bytes to Incoming Packets
- High Ratio Of Outgoing Bytes to Outgoing Packets
- Suspected High Throughput DNS Tunnel
- Suspected Low Throughput DNS Tunnel
- Unusual Total Outgoing Connection Duration
- Unusual Total Incoming Connection Duration
- Unusual Number of Anomalous Events
For more information, go to Edit the Policy Alert Severity Scale.
You can also use time filters to specify the time range to show activity for.
Traffic Sets
You can use traffic sets to filter the source and destination addresses of the activity records. The NetFlow and event records each have a set of source identifiers and destination identifiers. The source and destination IP address fields come directly from the monitored data traffic.
Additional fields in the activity record populate from metadata collected by ThreatSync+ from your environment or from trusted Internet naming services. Every IP address in each data flow is populated with these fields:
- Country Name
- Locality Name
- Domain Name
- Organization Name
- Asset Name
- Internal or External Network Zone
Traffic sets represent request and response activity between a source and a destination. Sources and destinations are defined as individual IP addresses or as groups of IP addresses that match a specified country name, locality name, domain name, organization name, asset name, or network zone.
A traffic set includes:
- The request activity from source to destination.
- The response activity from destination to source.
Add a Traffic Set Filter
Traffic sets enable you to group similar traffic based on source, destination, and traffic direction, which makes it easier to investigate potentially unusual activity.
To add a traffic set filter:
- On the Traffic page, click Add Traffic Set Filter.
The Add a Traffic Set Filter to Investigate dialog box opens.
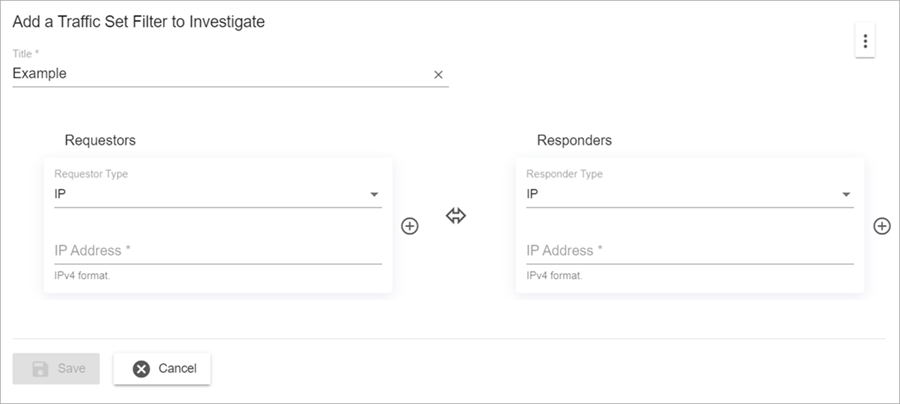
- Enter a title for the traffic set filter.
- In the Requestors section, select a Requestor Type. Select an associated subtype.
- In the Responders section, select a Responder Type. Select an associated subtype.
- (Optional) To add another field of the same type and subtype, click
 .
. - To select the direction of traffic between the requesters and responders, click the arrow. The default traffic direction is All activity between the Requestors and Responders.
- Click Save.
View All Inbound and Outbound Traffic of An IP Address — Configuration Example
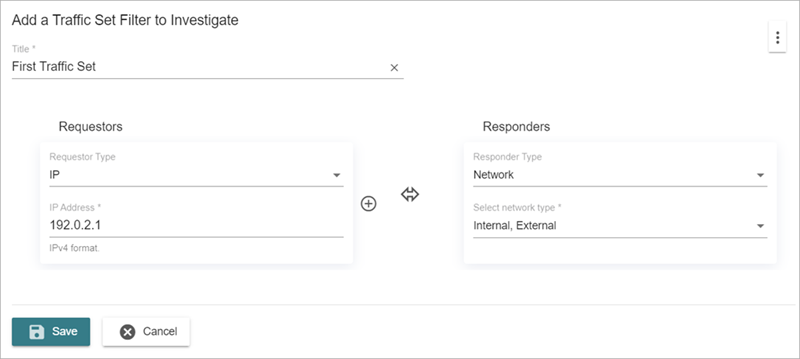
To view all traffic to and from an IP address, create two traffic sets.
For the first traffic set:
- In the Requestors section, for the Requestor Type, select IP.
- In the IP Address text box, enter an IP address.
- In the Responders section, from the Responders Type drop-down list, select Network.
- From the Select Network Type drop-down list, select Internal and External.
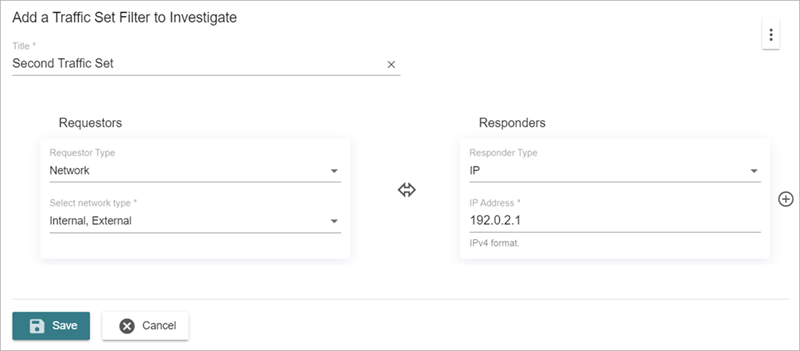
For the second traffic set:
- In the Requestors section, from the Requestor Type drop-down list, select Network.
- From the Select Network Type drop-down list, select Internal and External.
- In the Responders section, from the Responder Type, drop-down list, select IP.
- In the IP Address field, enter an IP address.
Activity Chart
The Activity Chart shows a multiple line graph with one series for each defined traffic set, filtered by the settings selected in the activity filters.
To hide or show each series, click the name in the chart legend.

Activity Records
The Activity Records section shows the individual conversation flow or event records selected. You can sort the table by column, or by ascending or descending order.
To filter the activity records, type text in the Filter Traffic text box. This does not filter the chart.
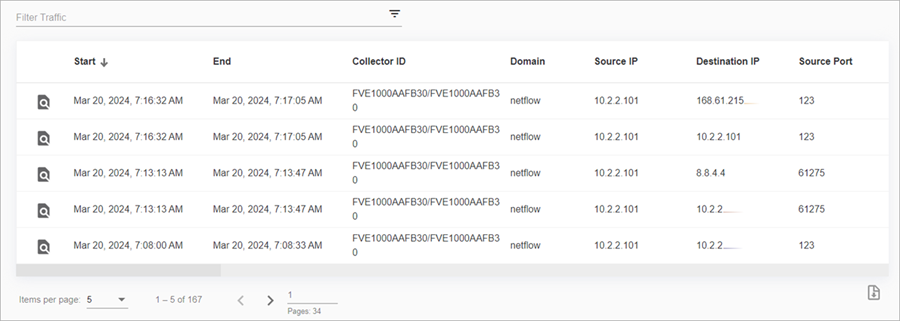
To view more details about a specific activity, click ![]() next to the activity.
next to the activity.
Known Actor Pane
To expand the Known Actor pane, in the upper-right section of the Traffic page, click ![]() . The Known Actor pane shows information about the IP addresses, devices, and ports that are included in your traffic sets and filters. You can expand each item in the panel to show more information and links to more details about the item.
. The Known Actor pane shows information about the IP addresses, devices, and ports that are included in your traffic sets and filters. You can expand each item in the panel to show more information and links to more details about the item.
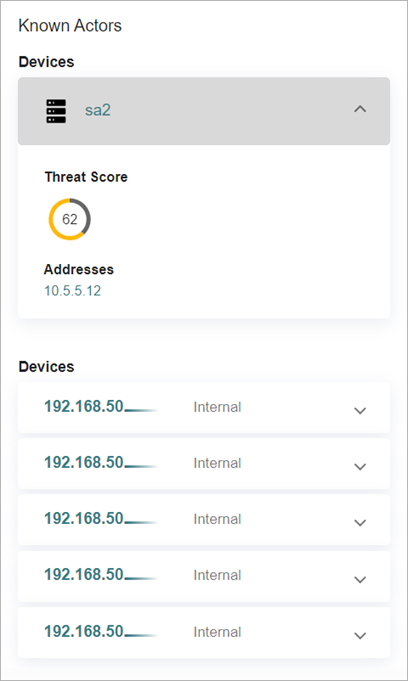
If you filter by port in the Activity Filters section, you can view ports in the Known Actor pane. In the Ports section, expand an item to view details about the port.
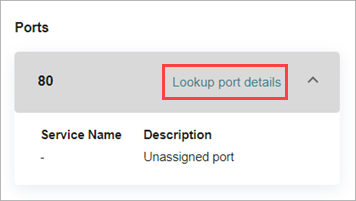
Click Lookup port details to go to an external site to learn more about the port.